

OpenTD.Results.Plot.SimplePlot Class Reference
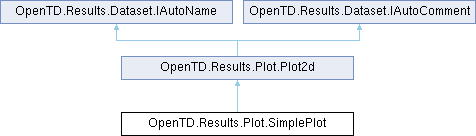
Last update: 16.07.2025An implementation of Plot2d using the .NET charting tools. Use this class to create 2d plots of solution data. One limitation: currently SimplePlot only allows one axis in each position, i.e., a primary and secondary x axis, and a primary and secondary y axis. If you try to plot more axes, it will throw an exception. More...
Public Member Functions | |
| SimplePlot (string title) | |
| SimplePlot () | |
| override Bitmap | GetAsImage () |
| override void | Show () |
| void | SetSeriesPaletteColor (int index, Color color) |
| void | SetPlotStyle (Plot2dStyle ps) |
| Plot2dStyle | GetPlotStyle () |
| void | AutoSetMarkers () |
| void | AutoSetAxes () |
| Makes sure each series is assigned to an axis with the correct dimension. Throws away unused axes. | |
| void | AutoScaleAxes () |
| Scales each axis based on the series attached to it. | |
| void | AutoNameXAxes () |
| void | AutoNameYAxesBasedOnSubtype () |
| void | AddSeries (Series2d series) |
| void | AddSeries (DataArray xData, DataArray yData) |
| void | AddSeries (DataArray yData) |
| void | AddSeries (DataArrayCollection dataCollection, bool useFirstArrayAsXData=false) |
| void | AddSeries (DataSubtype subtype, IEnumerable< double > values, UnitsData units=null, ItemIdentifier item=null) |
| void | AddSeries (IEnumerable< double > xData) |
| List< Series2d > | GetSeriesOnAxis (Axis a) |
| void | SaveAsImage (string pathname) |
| string | GetAsTable (string delimiter=",", bool consolidateXData=true) |
| void | SaveAsTable (string pathname, string delimiter=",", bool consolidateXData=true) |
| Saves the plot as a tabular data. | |
| override string | ToString () |
Protected Member Functions | |
| void | CheckData () |
| virtual void | GetReadyToOutput () |
| void | AutoSetLegend () |
| virtual string | GetSelfSuggestedName () |
| virtual string | GetSelfSuggestedComment () |
Properties | |
| Plot2dStyle | Plot2dStyle [get, set] |
| string | Title [get, set] |
| Series2dCollection | Series [get, set] |
| List< Axis > | XAxes [get, set] |
| List< Axis > | YAxes [get, set] |
| Legend | Legend [get, set] |
| double | AutoScaleAxesMarginPercent [get, set] |
| For axes that are autoscaled, this is the amount that each axis will be grown beyond the range of the data, as a percentage of the total range. Exceptions: if the minimum value of the data is 0, autoscaling will not extend the minimum value of the axis below 0. If the axis is for Record Numbers, autoscaling won't extend the minimum value of the axis below the first record number. | |
| bool | AutoUseMarkersForNonContinuousSeries [get, set] |
| If true, series that are detected to be non-continuous (because one or more y-values is NaN, for example) will have markers turned on automatically, to help spot orphaned points or small curve segments. This also applies to series with just one point. | |
| bool | TryToNameYAxesBasedOnSeriesSubtype [get, set] |
| Normally, Y axes are named based on their dimension, e.g., "Temperature". If this member is true, the plot will attempt to name them based on the subtype of the series applied to them, e.g., "Node Temperature" or "Lump Temperature". Defaults to false. | |
| AutoNamer | AutoNamer [get, set] |
| string | Name [get, set] |
| string | InternalSuggestedName [get, set] |
| AutoCommenter | AutoCommenter [get, set] |
| string | Comment [get, set] |
| string | InternalSuggestedComment [get, set] |
Detailed Description
An implementation of Plot2d using the .NET charting tools. Use this class to create 2d plots of solution data. One limitation: currently SimplePlot only allows one axis in each position, i.e., a primary and secondary x axis, and a primary and secondary y axis. If you try to plot more axes, it will throw an exception.
- See also
- OpenTD.Results.Plot.Plot2d
Constructor & Destructor Documentation
◆ SimplePlot() [1/2]
|
inline |
◆ SimplePlot() [2/2]
|
inline |
Member Function Documentation
◆ AddSeries() [1/6]
◆ AddSeries() [2/6]
|
inlineinherited |
◆ AddSeries() [3/6]
|
inlineinherited |
◆ AddSeries() [4/6]
|
inlineinherited |
◆ AddSeries() [5/6]
|
inlineinherited |
◆ AddSeries() [6/6]
|
inlineinherited |
◆ AutoNameXAxes()
|
inlineinherited |
◆ AutoNameYAxesBasedOnSubtype()
|
inlineinherited |
◆ AutoScaleAxes()
|
inlineinherited |
Scales each axis based on the series attached to it.
- Exceptions
-
OpenTDException AutoScaleNumIntervals must be positive.
◆ AutoSetAxes()
|
inlineinherited |
Makes sure each series is assigned to an axis with the correct dimension. Throws away unused axes.
◆ AutoSetLegend()
|
inlineprotectedinherited |
◆ AutoSetMarkers()
|
inlineinherited |
◆ CheckData()
|
inlineprotected |
◆ GetAsImage()
|
inlinevirtual |
Reimplemented from OpenTD.Results.Plot.Plot2d.
◆ GetAsTable()
|
inlineinherited |
◆ GetPlotStyle()
|
inlineinherited |
◆ GetReadyToOutput()
|
inlineprotectedvirtualinherited |
◆ GetSelfSuggestedComment()
|
inlineprotectedvirtualinherited |
◆ GetSelfSuggestedName()
|
inlineprotectedvirtualinherited |
◆ GetSeriesOnAxis()
◆ SaveAsImage()
|
inlineinherited |
◆ SaveAsTable()
|
inlineinherited |
Saves the plot as a tabular data.
- Parameters
-
pathname The output pathname. delimiter The column delimiter. consolidateXData if set to true, Will attempt to combine series x-values into the fewest possible columns. Will only combine x-values if they point to exactly the same source, i.e., it tests equality by reference, not by value.
◆ SetPlotStyle()
|
inlineinherited |
◆ SetSeriesPaletteColor()
|
inlineinherited |
◆ Show()
|
inlinevirtual |
Reimplemented from OpenTD.Results.Plot.Plot2d.
◆ ToString()
|
inlineinherited |
Property Documentation
◆ AutoCommenter
|
getsetprotectedinherited |
◆ AutoNamer
|
getsetprotectedinherited |
◆ AutoScaleAxesMarginPercent
|
getsetinherited |
For axes that are autoscaled, this is the amount that each axis will be grown beyond the range of the data, as a percentage of the total range. Exceptions: if the minimum value of the data is 0, autoscaling will not extend the minimum value of the axis below 0. If the axis is for Record Numbers, autoscaling won't extend the minimum value of the axis below the first record number.
◆ AutoUseMarkersForNonContinuousSeries
|
getsetinherited |
If true, series that are detected to be non-continuous (because one or more y-values is NaN, for example) will have markers turned on automatically, to help spot orphaned points or small curve segments. This also applies to series with just one point.
◆ Comment
|
getsetinherited |
Implements OpenTD.Results.Dataset.IAutoComment.
◆ InternalSuggestedComment
|
getsetinherited |
Implements OpenTD.Results.Dataset.IAutoComment.
◆ InternalSuggestedName
|
getsetinherited |
Implements OpenTD.Results.Dataset.IAutoName.
◆ Legend
|
getsetinherited |
◆ Name
|
getsetinherited |
Implements OpenTD.Results.Dataset.IAutoName.
◆ Plot2dStyle
|
getsetinherited |
◆ Series
|
getsetinherited |
◆ Title
|
getsetinherited |
◆ TryToNameYAxesBasedOnSeriesSubtype
|
getsetinherited |
Normally, Y axes are named based on their dimension, e.g., "Temperature". If this member is true, the plot will attempt to name them based on the subtype of the series applied to them, e.g., "Node Temperature" or "Lump Temperature". Defaults to false.
◆ XAxes
|
getsetinherited |
◆ YAxes
|
getsetinherited |
The documentation for this class was generated from the following file:
- C:/Users/mgarrett/source/repos/BuildsTdSuite/builds/TDDEV_ALPHA/buildXX/OpenTD.Results/Plot/SimplePlot.cs